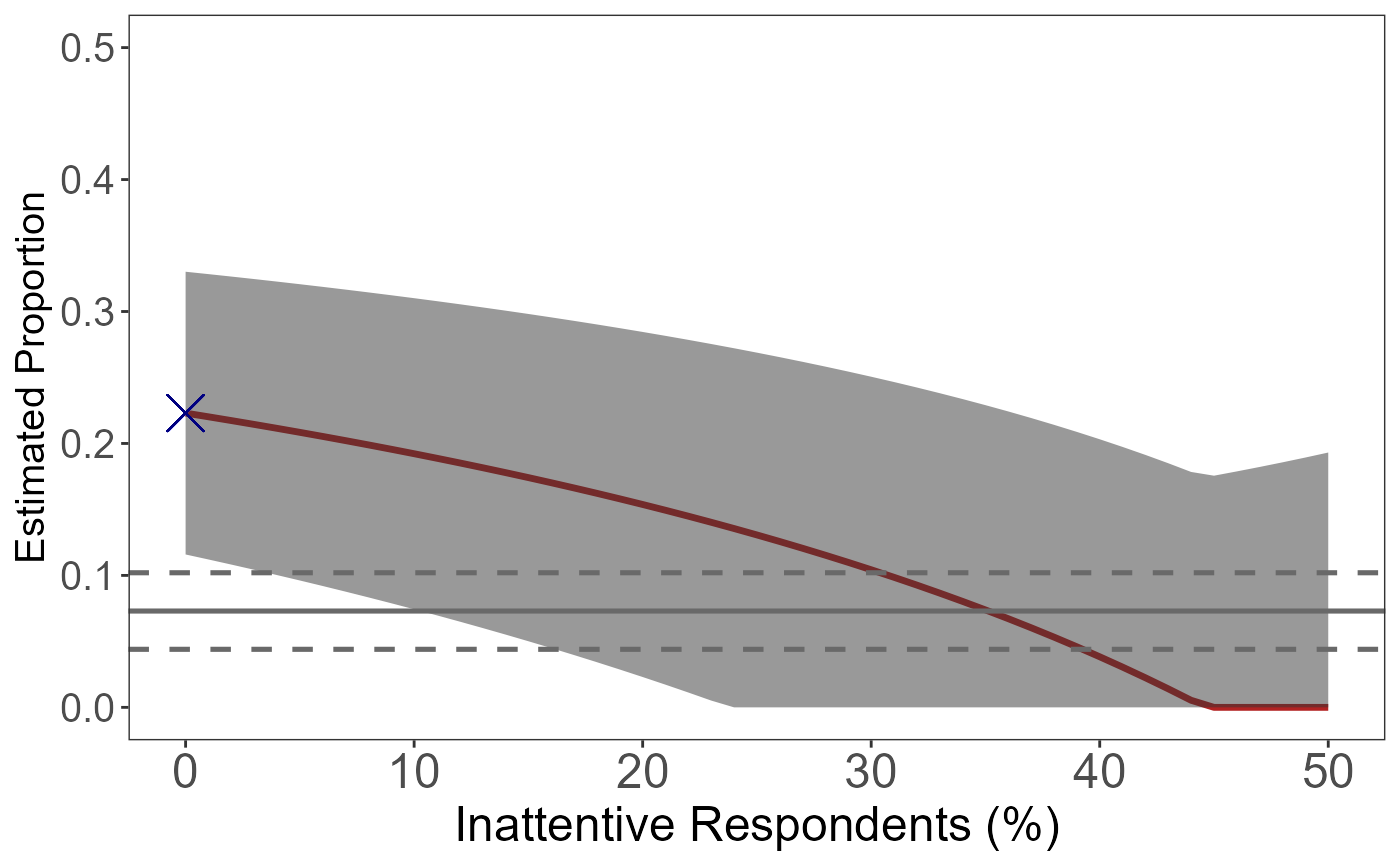
cmBound is used to apply a sensitivity analysis and
visualize the sensitivity bounds for naive crosswise estimates. The
sensitivity analysis assumes that inattentive respondents choose either
response option with equal probability.
cmBound(lambda.hat, p, N, dq = NULL, N.dq = NULL)Arguments
- lambda.hat
a value for the observed crosswise proportion: Prop(TRUE-TRUE or FALSE-FALSE).
- p
an auxiliary probability for the crosswise question. It must be a single finite value strictly between 0 and 1, excluding 0.5.
- N
a value for the number of survey respondents in the crosswise (and anchor) question.
- dq
a value for a point estimate from direct questioning (if available).
- N.dq
a value for the number of survey respondents in direct questioning (if available).
Value
A ggplot object visualizing the result of sensitivity analysis.
References
Atsusaka, Y. and Stevenson, R. T. (2023). The crosswise model for sensitive survey questions. doi:10.1017/pan.2021.43 .
See also
[bc_est()] for bias-corrected prevalence estimation.
Examples
p <- cmBound(lambda.hat=0.6385, p=0.25, N=310, dq=0.073, N.dq=310)
p
 p <- p + ggplot2::ggtitle("Sensitivity Analysis") +
ggplot2::theme(plot.title = ggplot2::element_text(size=20, face="bold"))
p <- p + ggplot2::ggtitle("Sensitivity Analysis") +
ggplot2::theme(plot.title = ggplot2::element_text(size=20, face="bold"))